
Is it more Scrooge Friday than Black Friday?
We analysed over 3 billion price changes over the last 2 years and saw a startling fact – more products go up in price than down during Black Friday week.
- Whilst over 30,000 products had dropped in price, as many as 55,280 had actually risen
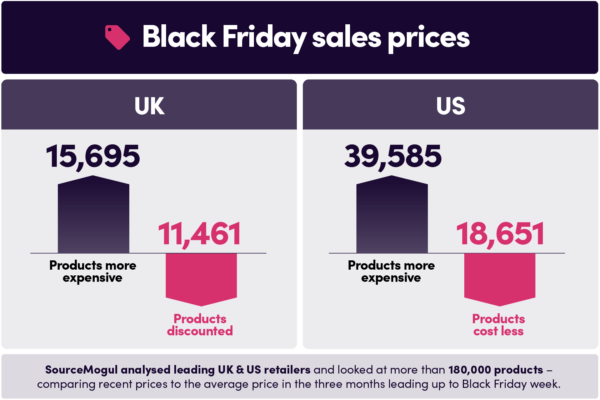
- We analysed leading UK and US retailers and looked at more than 180,000 products – comparing average prices in the last three months to those during Black Friday week
- The majority of products didn’t see any noticeable change in price beyond a 1% difference (100,865)
- What’s even more startling is that – in the UK – once all the price increases are added together, it comes to a whopping £253k – whilst the total discounts amount to just £64k.
We thought we would analyse and see if the renowned sales period is all it’s cracked up to be. Leading UK retailers were analysed and the research looked at more than 64,000 products – comparing recent prices to the average in the 3 months prior to the discount period.
The data showed that only 18% of products were cheaper versus their historic price trends, whereas 25% of products were actually more expensive. When added to the products that showed no change, 82% of products were either more expensive, or pricing was unchanged.
What’s even more startling is that if you added together all the individual product price increases, it comes to a whopping £253k – and a total of the discounts comes to just £64k.
Ed Brooks, CEO of SourceMogul, said: “Our algorithm monitors product price fluctuations and the facts are irrefutable…Black Friday isn’t all about price falls. Even with some margin of error, there’s just not enough scope in the analysis to conclude that Black Friday period is much cheaper overall. There’s still bargains to be had, but the overall picture is more nuanced than many may think.’
The contrast in the United States was also stark, with more than 120,000 products analysed; and whilst most prices were unchanged beyond the 1% difference, more than 39,000 had actually risen in price and 18,000 had dropped. On average, the individual price increases were revealed to be over one and a half times the price reductions of discounted products over the same period. In terms of actual cumulative cash changes across the products, those that went up amounted to over $256,000 compared to cumulative price reductions of only around $182,000.
The comparison tables from the data analysed was as follows:
| UK | Volume | Av. change | Cumulative cash difference |
|---|---|---|---|
| Total no products discounted | 11,461 | -5% | -£64,139.69 |
| Total more expensive | 15,695 | 17.2% | £253.085.54 |
| No change (less than 1%) | 36,873 | 0% | -£2176.25 |
| All products | 64,029 |
| US | Volume | Av. change | Cumulative cash difference |
|---|---|---|---|
| Total no products discounted | 18,651 | -7.2% | -£182,611.61 |
| Total more expensive | 39,585 | 11.6% | £256,527.27 |
| No change (less than 1%) | 63,995 | 0% | -£4,841.60 |
| All products | 122,231 |
Notes
Analysis completed on Nov 26th 2020
UK Dataset: three leading high street retailers, 64,000 products monitored, comparing average rolling 90-day prices to average pricing measured 22nd to 26th Nov 2020
US Dataset: three leading high street retailers, 120,000 products monitored, comparing average rolling 90-day prices to average pricing measured 22nd to 26th Nov 2020